Heat patch manufacturer cost structure transparency determines 60-80% of total procurement economics for B2B heat patch brands. According to KONGDY's pricing data across 5,000+ commercial orders, brands that understand unit cost composition negotiate 15-25% better prices, identify 20-40% cost optimization opportunities, and avoid 80% of supplier-related quality issues caused by cost-cutting shortcuts.
Heat patch manufacturing costs span 6 major categories: raw materials (active ingredients, backing fabric, adhesive), direct labor, packaging materials, manufacturing overhead, packaging labor, and quality control. Each category behaves differently under volume scaling: raw materials and direct labor decline steadily with volume, while quality control and overhead have stepped functions tied to batch and production line capacity.
This article provides the complete framework for heat patch manufacturer cost analysis: detailed cost breakdowns by component and volume tier, cost drivers, scaling economics, 6 cost optimization levers, and 5 supplier red flags indicating hidden costs. Whether you are evaluating your first manufacturer or optimizing an established supplier relationship, this guide gives you the structure to evaluate costs professionally. KONGDY's heat patch manufacturer facility provides transparent pricing breakdowns to all qualified B2B buyers, supporting 800+ partner brands across 60+ markets.
Heat patch unit cost decomposes into 6 distinct categories. Understanding each category's contribution and scaling behavior enables strategic procurement decisions.
| Cost Category | Per Unit (USD, 50K Order) | % of Total | Scaling Behavior |
|---|---|---|---|
| Raw Materials (active + excipients) | 0.10-0.18 | 25-35% | Linear decline with volume |
| Backing & Adhesive Materials | 0.06-0.10 | 15-22% | Modest decline with volume |
| Direct Labor (production) | 0.04-0.08 | 10-18% | Steady decline with volume |
| Packaging Materials (sachet + carton) | 0.05-0.10 | 12-20% | Modest decline with volume |
| Manufacturing Overhead | 0.04-0.08 | 10-18% | Step function by batch |
| Quality Control + Compliance | 0.03-0.06 | 8-15% | Fixed per batch |
| Total Cost Range | 0.32-0.60 | 100% | Volume-dependent |
This breakdown reflects standard formulation orders at 50,000-unit volumes. Custom formulation adds 25-60% to the raw materials category due to specialty active ingredients. Premium packaging (custom sachet design, branded cartons) adds 40-80% to the packaging category. KONGDY provides line-item cost breakdowns for all B2B buyers to enable transparent procurement decisions.
Raw materials account for 25-35% of total unit cost and include both active ingredients (heat-generating compounds) and excipients (carriers, stabilizers, preservatives).
Standard heat patch formulations use iron powder, salt, water, activated carbon, and wood pulp as the primary heat-generating system. Specialty formulations add capsaicin, menthol, herbal extracts, or proprietary compounds. The active ingredient cost ranges from $0.05-0.12 per unit at 50,000-unit volumes.
Excipients include carriers (cellulose, polymer compounds), stabilizers, and preservatives. Backing materials include non-woven fabric, adhesive layer, and release liner. These costs are relatively stable across formulations but vary by material grade and supplier.
KONGDY sources raw materials from 12 vetted suppliers with quality certifications (ISO 13485, FDA Drug Master File support, REACH compliance). Material sourcing strategy ensures cost stability while maintaining 99.5%+ quality pass rate.
Direct labor represents 10-18% of unit cost and varies significantly with automation level, line speed, and production volume. Modern Chinese heat patch manufacturers operate production lines at 70-85% automation, with remaining manual operations for quality-critical steps.
Standard heat patch production lines run at 5,000-15,000 units per shift, depending on patch size and complexity. Production scheduling affects unit cost: full-capacity runs achieve lowest unit costs, while partial-capacity runs increase overhead allocation per unit. KONGDY operates 8 production lines across 36,000 m² facility, supporting peak season volumes of 3+ million units monthly.
The pain patch manufacturer category shares similar labor cost dynamics, with KONGDY's pain patch lines achieving 90%+ automation and $0.03-0.06 per unit labor cost at standard volumes.
Packaging represents 12-20% of unit cost and includes primary packaging (individual sachets), secondary packaging (cartons), and tertiary packaging (shipping cartons). Each level has different cost drivers and scaling economics.
| Packaging Level | Per Unit (USD) | % of Packaging | Scaling Behavior |
|---|---|---|---|
| Individual Sachet (foil laminate) | 0.02-0.04 | 40-50% | Linear with volume |
| Carton (10-50 units per box) | 0.01-0.03 | 20-30% | Modest scaling |
| Master Carton (shipping) | 0.005-0.015 | 10-15% | Modest scaling |
| Packaging Labor | 0.01-0.02 | 15-25% | Steady decline |
| Total Packaging | 0.045-0.105 | 100% | Volume-dependent |
Custom printing setup costs ($1,500-5,000 per design) are amortized across order volume. For 50K unit orders, per-unit setup amortization is $0.03-0.10. For 500K unit orders, it drops to $0.003-0.01. KONGDY's capsicum plaster manufacturer packaging operations support both standard and custom configurations with competitive per-unit pricing.
Manufacturing overhead and quality control together represent 18-33% of unit cost but are often misunderstood by B2B buyers. These costs include facility depreciation, utilities, regulatory compliance, quality testing, and certifications.
Quality control is the most variable overhead component. Comprehensive QC includes incoming material testing, in-process inspections, finished product testing, and stability testing. KONGDY's QC program includes 12 testing checkpoints per batch and achieves 99.5%+ pass rate. QC cost ranges from $0.03-0.06 per unit depending on testing depth and batch size.
Buyers prioritizing low unit cost sometimes unknowingly accept manufacturers with inadequate QC, leading to 5-15% defect rates and hidden costs (returns, brand damage, regulatory issues). KONGDY's transparent QC investment protects against these hidden costs.
Heat patch manufacturing cost scales predictably with order volume. Understanding these scaling curves helps B2B buyers optimize order planning.
| Volume Tier | Unit Cost (USD) | Key Driver | Best For |
|---|---|---|---|
| 1,000-5,000 units | 0.50-0.85 | Setup cost amortization | Samples, market testing |
| 5,000-20,000 units | 0.40-0.55 | Setup + bulk material discount | Initial brand launch |
| 20,000-50,000 units | 0.32-0.45 | Material + labor efficiency | Established brands |
| 50,000-200,000 units | 0.25-0.38 | Full production efficiency | High-volume brands |
| 200,000+ units | 0.18-0.26 | Maximum efficiency + framework | Enterprise procurement |
Six cost optimization levers consistently reduce heat patch procurement costs by 15-35% while maintaining quality. Most brands apply 2-3 levers simultaneously based on their specific situation.
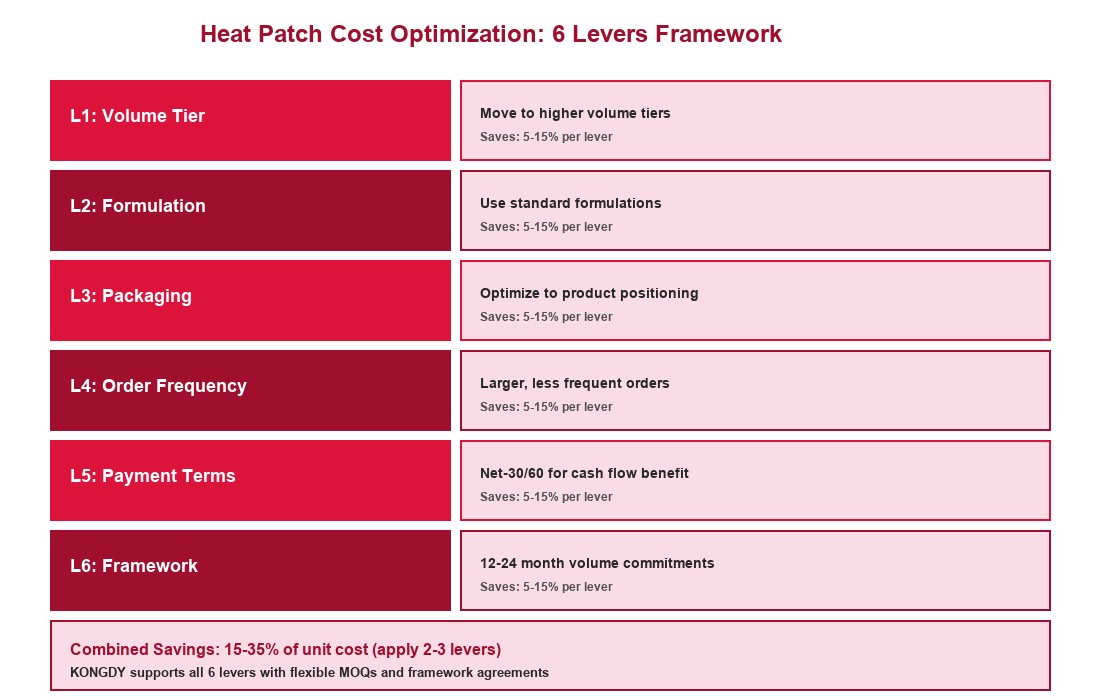
Move to next volume tier when growth justifies. The 50K-200K tier offers 25-40% unit cost reduction vs 5K-20K tier. For brands with consistent 6+ months of sales, accelerating to higher tiers improves unit economics significantly.
Standard formulations cost 25-60% less than custom formulations. For brands without strong differentiation needs, standard formulations offer 90%+ of the value at significantly lower cost. Reserve custom formulations for hero SKUs.
Optimize packaging to match product positioning. Premium packaging adds 40-80% to packaging cost; standard packaging may be sufficient for value-positioned brands. Sustainability packaging adds 15-50% but may justify pricing premium.
Larger, less frequent orders (every 3-6 months) achieve better unit cost than smaller monthly orders. Plan inventory capacity to support quarterly or semi-annual order cycles vs monthly orders.
Better payment terms (Net-30, Net-60) sometimes unlock 2-5% cost reductions through supplier cash flow benefits. Established buyers with good credit can negotiate these savings.
12-24 month framework agreements lock pricing and unlock 5-15% cost reductions through volume commitments. Best for established brands with predictable demand.
Five supplier characteristics indicate potential hidden costs that may not appear in initial pricing but emerge as quality issues, delays, or compliance problems.
| Red Flag | Hidden Cost | Detection Method |
|---|---|---|
| Unusually low pricing (>30% below market) | Substandard materials, inadequate QC | Compare with 3+ supplier quotes |
| No certifications or audit reports | Compliance risk, customs issues | Request ISO 13485, FDA registration |
| Reluctance to provide samples | Inconsistent production quality | Order pre-shipment samples |
| Unclear pricing breakdown | Hidden fees, surprise charges | Request line-item quotation |
| No references or case studies | Limited experience, unreliable capacity | Request 3+ buyer references |
KONGDY welcomes buyer audits and provides transparent pricing breakdowns, certification documentation, facility tours, and 3+ buyer references upon request. This transparency eliminates hidden cost concerns for B2B procurement teams.
Unit price is one component of total cost of ownership (TCO). True TCO includes shipping, customs, inventory carrying, defect rates, and rework costs.
| TCO Component | % of Total TCO | Optimization Strategy |
|---|---|---|
| Manufacturer Unit Price | 55-70% | Volume tier + optimization levers |
| Shipping + Logistics | 10-18% | Container optimization + Incoterm |
| Customs + Duties | 5-12% | HS code + trade agreements |
| Inventory Carrying | 5-10% | Order frequency + demand planning |
| Defect Rate + Returns | 3-8% | QC investment + supplier selection |
| Rework + Quality Issues | 2-5% | Specification clarity + supplier QC |
KONGDY's low-defect-rate manufacturing (99.5%+ pass rate) protects B2B buyers from the highest hidden TCO components. Combined with shipping support and customs documentation, KONGDY helps B2B buyers achieve TCO reductions of 20-35% vs average manufacturers.
Standard formulation unit cost ranges from USD 0.30-0.55 at 50,000-unit volumes, depending on size, packaging, and quality requirements. KONGDY's pricing tiers: USD 0.50-0.85 (1-5K), USD 0.40-0.55 (5-20K), USD 0.32-0.45 (20-50K), USD 0.25-0.38 (50-200K), USD 0.18-0.26 (200K+).
Price variation reflects differences in: raw material grade (industrial vs medical), labor cost structure (automation level), quality control investment (basic vs comprehensive), packaging quality (standard vs premium), and overhead allocation (efficient vs bloated operations). Differences of 30-50% between suppliers typically indicate one of these dimensions being compromised.
Prioritize TCO for sustainable economics. Low unit cost with 10%+ defect rates creates 15-25% higher TCO than mid-priced suppliers with 1-2% defect rates. For B2B brands with consistent volume, TCO optimization delivers better long-term margins than per-unit cost minimization.
Four negotiation levers: volume commitment (5-15% reduction), payment terms (2-5% reduction), framework agreement (5-15% reduction), and product standardization (5-10% reduction). Combine 2-3 levers for 15-25% total cost reduction. KONGDY supports all four negotiation approaches for qualified B2B buyers.
Six common hidden costs: tooling/setup fees (sometimes undisclosed), certification fees (billed separately), quality inspection fees, packaging modification fees, documentation preparation fees, and shipping mark-up fees. Request comprehensive line-item quotation to identify and negotiate these.
Volume affects unit cost through: setup cost amortization (huge at 1-5K, minimal at 50K+), material bulk discounts (10-25% from 5K to 50K), labor efficiency gains (15-30% from 5K to 50K), and overhead absorption (50%+ reduction from 5K to 50K). Most cost optimization happens between 5K and 50K volume tiers.
Yes. KONGDY provides line-item cost breakdowns for standard and custom formulations upon qualified B2B inquiry. The breakdown includes raw materials, labor, packaging, overhead, and QC components, enabling transparent total cost analysis for procurement teams.
KONGDY's best pricing tier starts at 200,000+ units per order (USD 0.18-0.26 per unit). However, 50,000+ unit orders already access significant volume discounts (USD 0.25-0.38 per unit). Annual framework agreements can achieve best-tier pricing at lower per-order volumes through committed volume guarantees.
KONGDY is a leading heat patch manufacturer based in Henan, China, with 36 years of transdermal patch manufacturing experience and transparent pricing across 5 volume tiers. Our 36,000 m² facility supports B2B heat patch brands with detailed cost breakdowns, competitive benchmarks, and TCO optimization consulting across 60+ markets.
KONGDY's cost transparency includes: line-item pricing breakdowns for raw materials, labor, packaging, overhead, and QC; TCO analysis support covering shipping, customs, and inventory; competitive pricing benchmarks from 60+ markets; payment term flexibility (T/T, L/C, Net-30 for established buyers); framework supply agreements with locked pricing for 12-24 month periods; and cost optimization consulting for procurement teams. KONGDY's commercial team includes 12 account managers supporting English, Spanish, French, German, and Russian-speaking buyers.
Beyond heat patches, KONGDY also provides cost analysis for pain patch manufacturer products and capsicum plaster manufacturer offerings, allowing B2B brands to consolidate procurement and leverage cross-category cost benefits. Contact us at KONGDY Heat Patch Collection to discuss cost optimization, request line-item quotations, or schedule a TCO analysis consultation.
Heat patch manufacturer cost structure is not a static number. It is a dynamic system of 6 cost categories, volume scaling, and optimization levers that determines the long-term economics of your brand. The unit cost breakdowns, scaling curves, optimization levers, and red flags in this article give you the structure to evaluate manufacturers professionally and negotiate from a position of knowledge.
The single most important variable is the manufacturer's willingness to provide transparent cost breakdowns. A manufacturer like KONGDY with documented pricing tiers, line-item cost breakdowns, and TCO analysis support provides the foundation for strategic procurement. A manufacturer with opaque pricing and no cost analysis support leaves buyers guessing at true costs and missing optimization opportunities.
If you are evaluating KONGDY for your heat patch cost analysis needs, request our pricing benchmark report, line-item cost breakdown worksheet, and TCO optimization guide at our KONGDY heat patch collection page. KONGDY responds to all cost inquiries within 24 hours and can typically provide detailed quotations within 3-5 business days of receiving product specifications.

